Project Summary
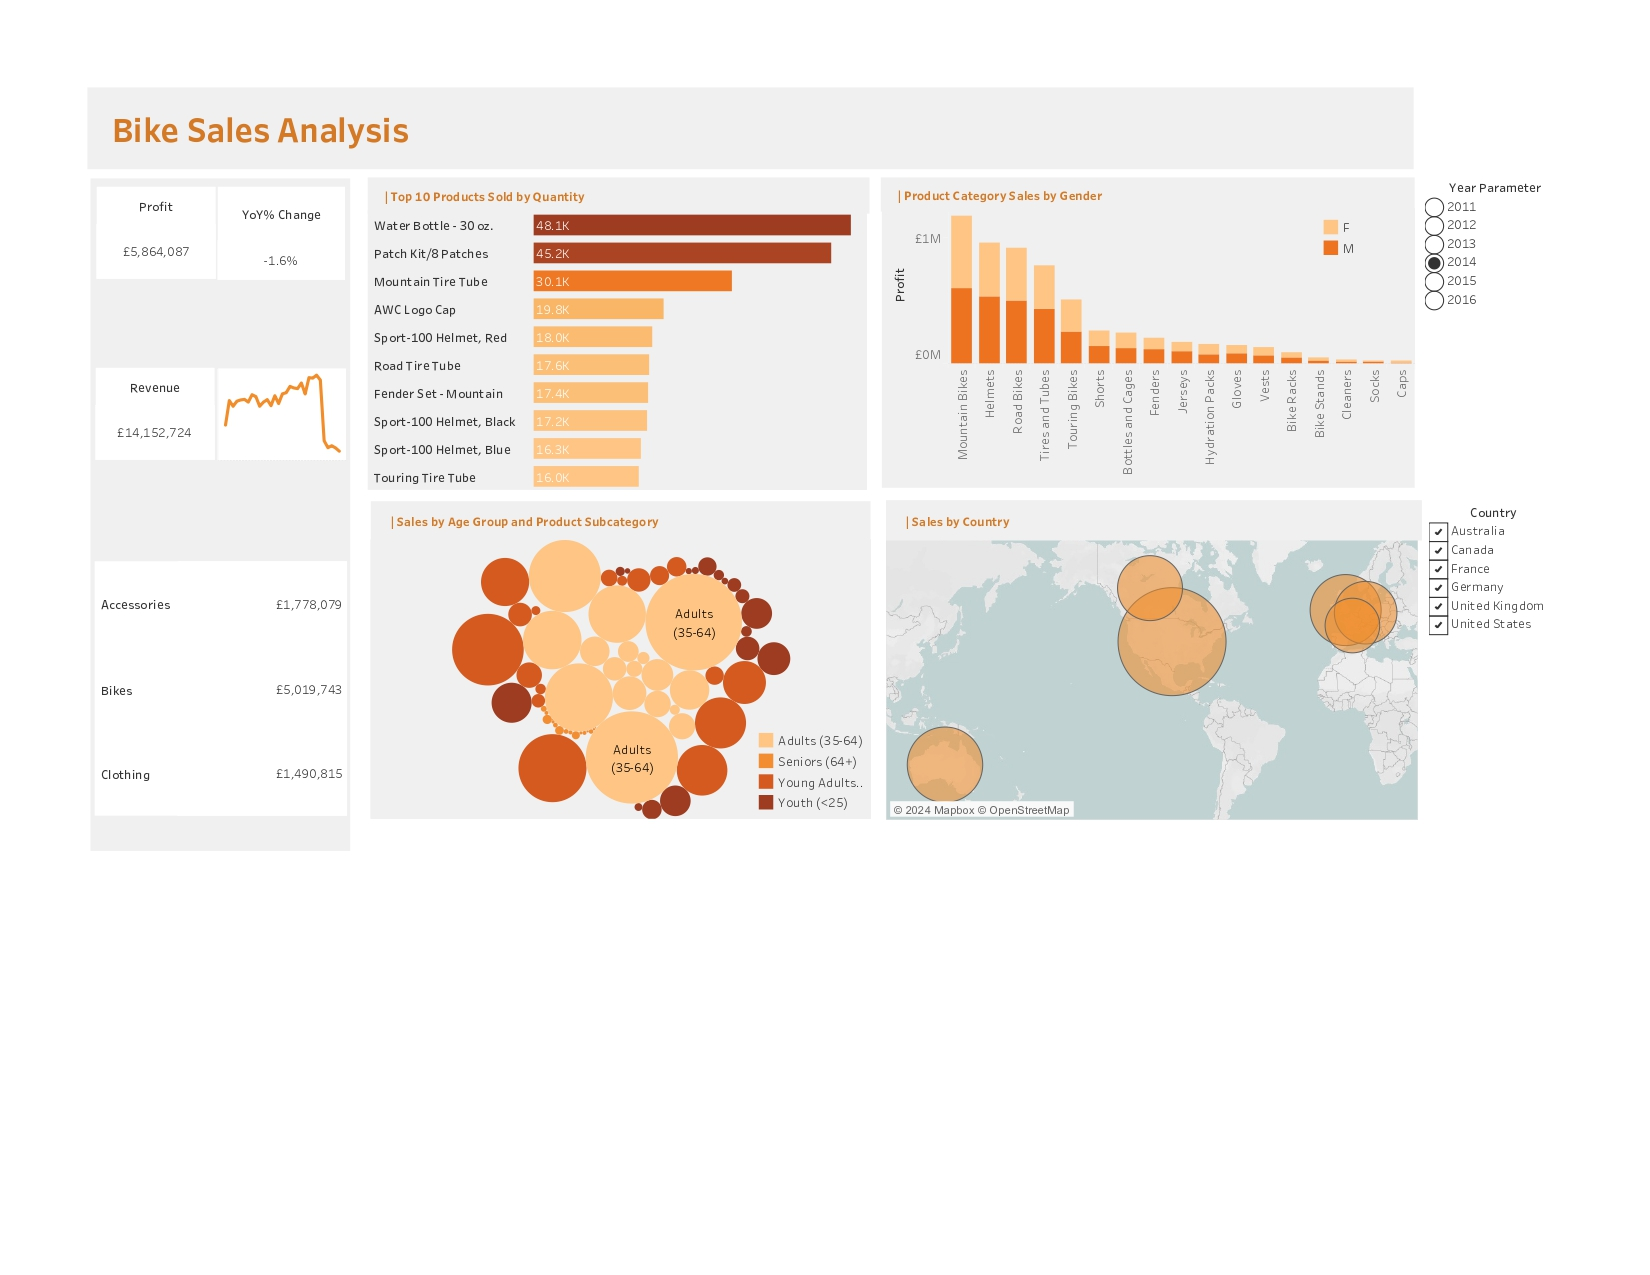
This Tableau dashboard supports fast performance review and deeper exploration. It starts with headline commercial metrics, then breaks results down by top-selling products (by quantity) and segmentation views that help stakeholders understand who is buying, what they buy and where demand is strongest.
Headline KPIs (from the dashboard)
Revenue
£14,152,724
Profit
£5,864,087
YoY % Change
-1.6%
Year Selector
2011 – 2016
Values shown are taken from the KPI tiles and year parameter visible on the Tableau dashboard.
Key Insights
- The dashboard provides category-level context (for example: Accessories £1,778,079, Bikes £5,019,743, Clothing £1,490,815), helping stakeholders understand which areas contribute most to sales performance.
- The “Top 10 Products Sold by Quantity” view surfaces the highest-volume items, led by Water Bottle - 30 oz. (48.1K), Patch Kit/8 Patches (45.2K), and Mountain Tire Tube (30.1K), supporting inventory and merchandising conversations.
- Segmentation views are included to explore differences in sales by gender and by age group, helping stakeholders understand customer mix and demand patterns rather than relying on averages.
- The “Sales by Country” view supports geographic prioritisation and cross-market comparison, including markets such as the United Kingdom, United States, Germany, France, Canada and Australia.
What This Project Demonstrates
- Executive KPI reporting with trend context (revenue, profit, YoY change)
- Product volume insight for operational decision-making
- Customer and geography segmentation for commercial strategy
- Interactive exploration via filters/parameters for stakeholder self-service